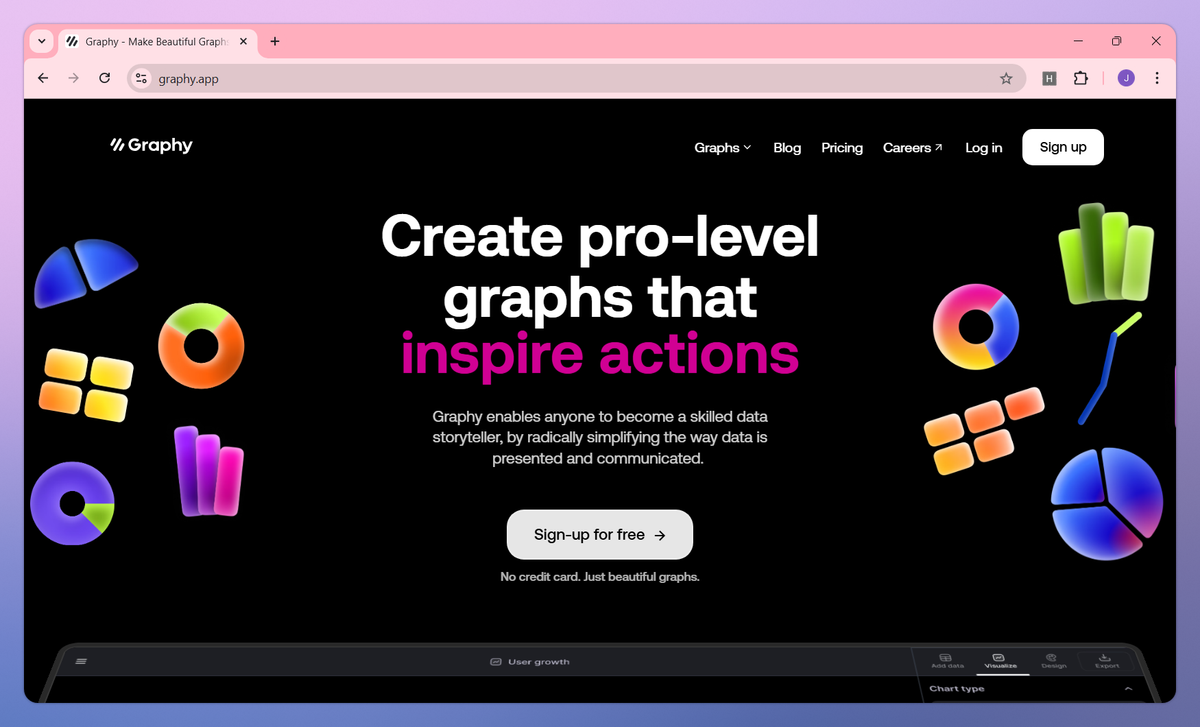
What is Graphy?
Graphy is a data visualization tool that simplifies the creation of interactive charts and dashboards for data storytelling. It imports data from multiple sources with a single click, builds beautiful customizable graphs with annotations, and shares visualizations across different platforms to help marketers, founders, and analysts communicate insights and drive data-informed decisions.
What sets Graphy apart?
Graphy sets itself apart with a no-code interface that makes data visualization accessible for professionals who lack technical expertise. The tool's AI-assisted chart suggestions are particularly valuable for business teams who need to understand patterns and trends without data science training. Graphy's one-click refresh system allows teams to update reports in seconds when source data changes, saving hours compared to manual chart recreation in traditional tools.
Graphy Use Cases
- Create interactive dashboards
- Automate data reporting
- Visualize marketing metrics
- Generate investor updates
Who uses Graphy?
Features and Benefits
'/%3e%3cdefs%3e%3clinearGradient%20id='paint0_linear_1182_27871'%20x1='12.385'%20y1='12.5872'%20x2='48.2299'%20y2='32.1489'%20gradientUnits='userSpaceOnUse'%3e%3cstop%20offset='0.0938117'%20stop-color='%2352EB07'/%3e%3cstop%20offset='0.347535'%20stop-color='%233EF040'/%3e%3cstop%20offset='0.768595'%20stop-color='%2300FFF7'/%3e%3c/linearGradient%3e%3c/defs%3e%3c/svg%3e) Import data from multiple sources like Google Analytics, HubSpot, and spreadsheets with a single click, eliminating the need for complex integrations or technical knowledge. One-Click Data Import
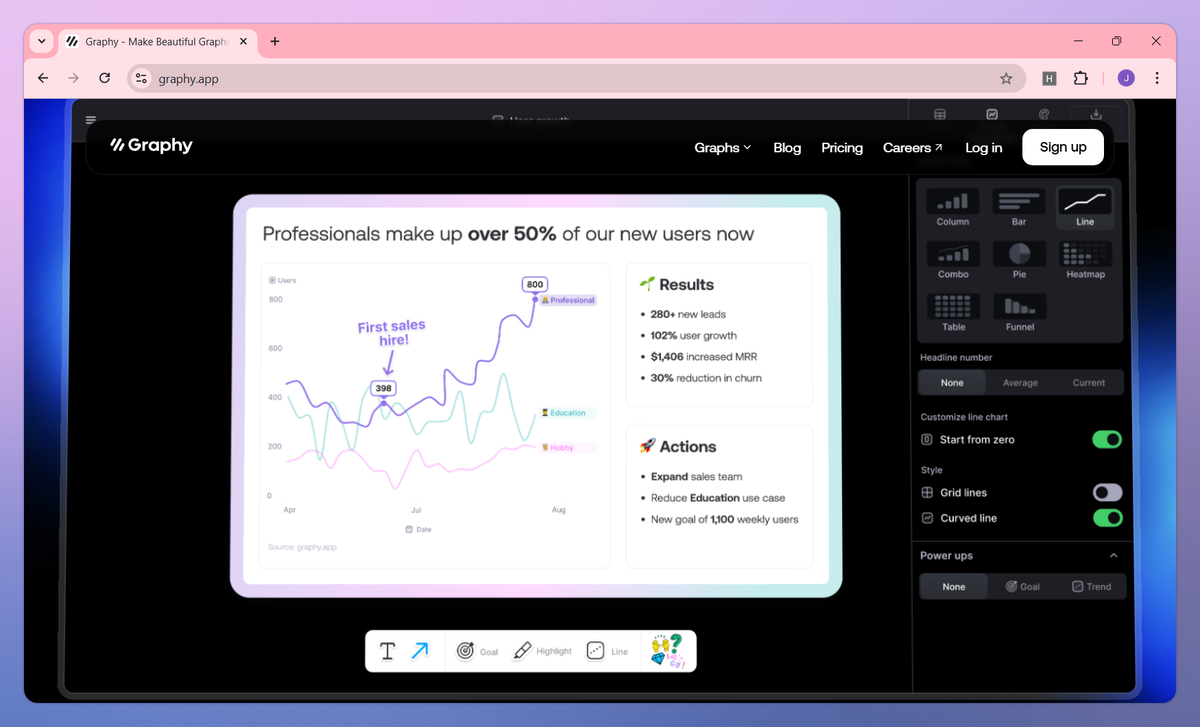
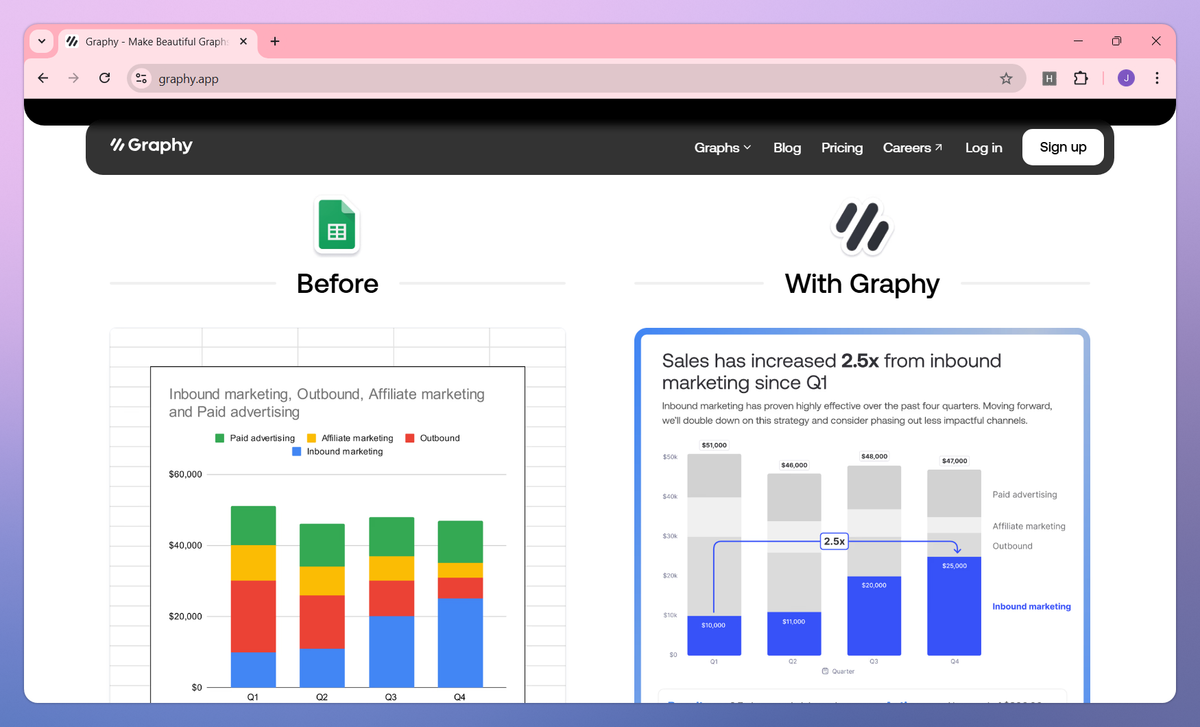
Import data from multiple sources like Google Analytics, HubSpot, and spreadsheets with a single click, eliminating the need for complex integrations or technical knowledge. One-Click Data Import - Create professional, visually appealing charts and graphs that transform complex data into clear, actionable insights within minutes. Beautiful Interactive Visualizations
- Add context to your data with annotations, trend lines, goals, and AI-generated insights that help explain the meaning behind the numbers. Data Storytelling Tools
- Share interactive reports across multiple platforms including Slack, email, Notion, and presentation tools, or export high-quality images for decks and documents. Simplified Sharing
- Update weekly or monthly reports with a single click, saving hours of manual work while keeping stakeholders informed with the latest data. Quick Report Refreshing
Graphy Pros and Cons
'/%3e%3cpath%20fill-rule='evenodd'%20clip-rule='evenodd'%20d='M16.0466%206.18948C16.3178%206.46068%2016.3178%206.90038%2016.0466%207.17157L8.40771%2014.8105C8.13652%2015.0817%207.69682%2015.0817%207.42562%2014.8105L3.9534%2011.3382C3.6822%2011.067%203.6822%2010.6273%203.9534%2010.3561C4.2246%2010.085%204.66429%2010.085%204.93549%2010.3561L7.91667%2013.3373L15.0645%206.18948C15.3357%205.91828%2015.7754%205.91828%2016.0466%206.18948Z'%20fill='%23343634'/%3e%3cdefs%3e%3clinearGradient%20id='paint0_linear_1569_59'%20x1='0.289288'%20y1='-0.211567'%20x2='31.2845'%20y2='15.6364'%20gradientUnits='userSpaceOnUse'%3e%3cstop%20offset='0.0938117'%20stop-color='%2352EB07'/%3e%3cstop%20offset='0.347535'%20stop-color='%233EF040'/%3e%3cstop%20offset='0.768595'%20stop-color='%2300FFF7'/%3e%3c/linearGradient%3e%3c/defs%3e%3c/svg%3e) Intuitive and user-friendly interface makes course creation simple
Intuitive and user-friendly interface makes course creation simple - Advanced security features protect content from unauthorized sharing
- Comprehensive all-in-one platform for course creation and delivery
- Excellent customer support with personalized onboarding assistance
- Affordable pricing compared to similar platforms
 Platform suffers from frequent technical glitches and bugs
 - Limited customization options on basic subscription plans
- Mobile app lacks features compared to web version
- Marketing and landing page capabilities need improvement
- Support response times can be inconsistent
Pricing
- unlimited charts
- share anywhere
- limited AI use
- brand colors
- remove watermark
- unlimited charts
- unlimited AI features
- dedicated support
- enhanced privacy controls
Graphy Alternatives