
Infogram — AI Data Visualization Tool
Check Infogram at: 


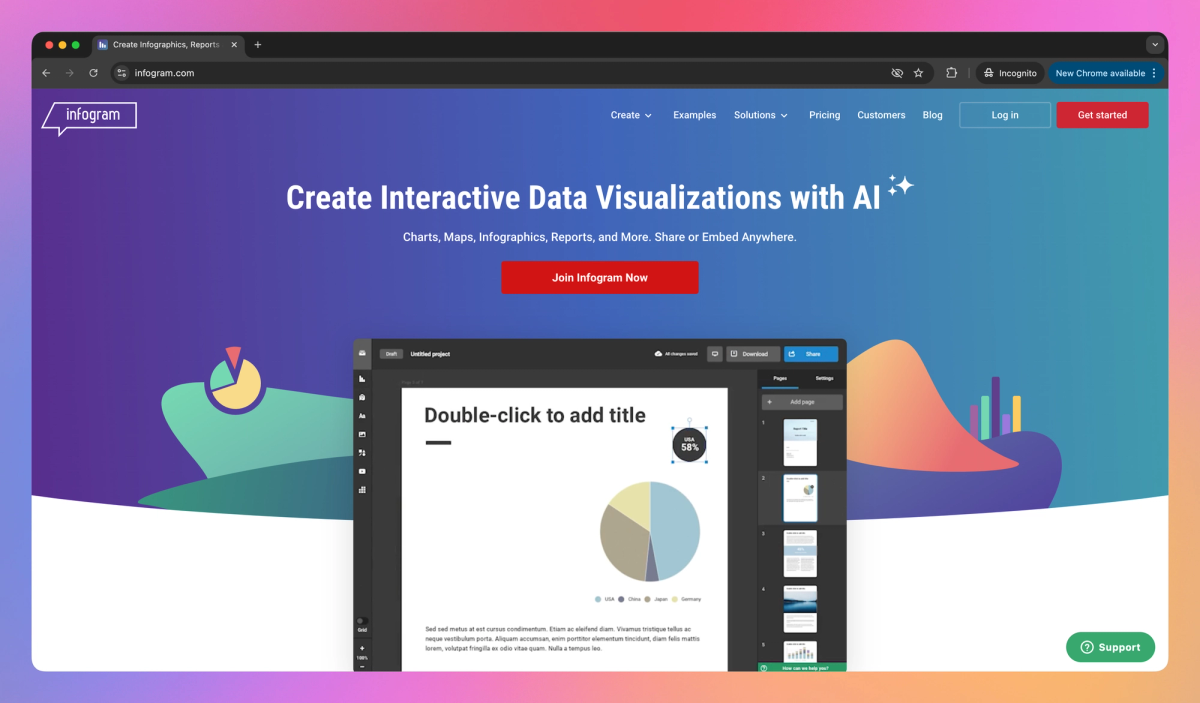
What is Infogram?
Infogram allows journalists and marketers to produce interactive infographics, charts, and reports. The tool offers data import options, customizable templates, and sharing features to help users communicate complex information visually.
What sets Infogram apart?
Infogram sets itself apart with its ability to create animated and interactive data visualizations, allowing data journalists to bring complex stories to life. The platform's real-time collaboration features help content marketing teams work together on projects, ensuring brand consistency across all visual content. Infogram's engagement analytics give publishers insights into how their audience interacts with charts and infographics, helping them refine their data storytelling approach.
Infogram Use Cases
- Data visualization
- Interactive infographics
- Engaging reports
- Social media graphics
Who uses Infogram?
Marketing Managers Social Media Managers Content Strategists Entrepreneurs Data Analysts Public Relations Specialists Executives Marketing Coordinators Market Research Analysts Business Analysts Brand Managers Content Creators Digital Marketing Specialists Project Managers Content Marketers Teachers Professors Communications Managers Business Development Managers Sales Managers
Features and Benefits
'/%3e%3cdefs%3e%3clinearGradient%20id='paint0_linear_1182_27871'%20x1='12.385'%20y1='12.5872'%20x2='48.2299'%20y2='32.1489'%20gradientUnits='userSpaceOnUse'%3e%3cstop%20offset='0.0938117'%20stop-color='%2352EB07'/%3e%3cstop%20offset='0.347535'%20stop-color='%233EF040'/%3e%3cstop%20offset='0.768595'%20stop-color='%2300FFF7'/%3e%3c/linearGradient%3e%3c/defs%3e%3c/svg%3e) Create animated and interactive charts, maps, and infographics to present data in an engaging format. Interactive Visualizations
Create animated and interactive charts, maps, and infographics to present data in an engaging format. Interactive Visualizations - Import data from various sources including spreadsheets, databases, and cloud storage platforms to create up-to-date visualizations. Data Import and Integration
- Apply your brand's colors, fonts, and logo to maintain consistency across all your visual content. Brand Customization
- Work together with team members in real-time, share projects, and gather feedback within the platform. Collaboration Tools
- Track content performance with analytics on views, engagement, and audience demographics to inform your content strategy. Analytics and Insights
Infogram Pros and Cons
Pros
'/%3e%3cpath%20fill-rule='evenodd'%20clip-rule='evenodd'%20d='M16.0466%206.18948C16.3178%206.46068%2016.3178%206.90038%2016.0466%207.17157L8.40771%2014.8105C8.13652%2015.0817%207.69682%2015.0817%207.42562%2014.8105L3.9534%2011.3382C3.6822%2011.067%203.6822%2010.6273%203.9534%2010.3561C4.2246%2010.085%204.66429%2010.085%204.93549%2010.3561L7.91667%2013.3373L15.0645%206.18948C15.3357%205.91828%2015.7754%205.91828%2016.0466%206.18948Z'%20fill='%23343634'/%3e%3cdefs%3e%3clinearGradient%20id='paint0_linear_1569_59'%20x1='0.289288'%20y1='-0.211567'%20x2='31.2845'%20y2='15.6364'%20gradientUnits='userSpaceOnUse'%3e%3cstop%20offset='0.0938117'%20stop-color='%2352EB07'/%3e%3cstop%20offset='0.347535'%20stop-color='%233EF040'/%3e%3cstop%20offset='0.768595'%20stop-color='%2300FFF7'/%3e%3c/linearGradient%3e%3c/defs%3e%3c/svg%3e) Easy to create visually appealing infographics and charts
Easy to create visually appealing infographics and charts - Intuitive drag-and-drop interface for non-designers
- Wide variety of templates and customization options
- Collaboration features for team projects
- Mobile-friendly output for easy sharing
- Integrates with various data sources
- Offers interactive and animated graphics
Cons
 Limited advanced customization in free version
 - Learning curve for complex features
- Some users report occasional data loss
- Mobile editing experience could be improved
- Pricing may be high for individual users
- Limited offline functionality
- Restricted font options for maintaining brand identity
Pricing
Basic Price not available
- 37+ interactive charts types
- Up to 10 projects
- Up to 5 pages per project
- 13 map types
- Publish your content online
- Import data
- Object animations
Pro $19/mo
- All Basic features
- Up to 100 projects
- Up to 10 pages per project
- 100+ premium templates
- 550+ map types
- 1 million images and icons available
- Set your favorite colors, fonts, and images
- Advanced image editing features
- Download HD images and videos
- Privacy control
- Data connections and live data
Business $67/mo
- All Pro features
- Up to 1,000 projects
- Unlimited pages per project
- Your brand logo, color palette, fonts, and image assets
- Your own logo
- Basic analytics
- SQL Connectors, Iframe integrations
- Version history
- Callouts, custom links and page linking
- Presenter notes
Team $149/mo
- All Business features
- Up to 3,000 projects
- Single team functionality starting with 3 users
- Real-time collaboration
- Commenting
- Engagement analytics
- Tracking links
- Team templates
Enterprise Price not available
- All Team features
- Up to 10,000+ projects
- Branded public profile and subdomain
- Multiple team functionality starting with 10 users
- Advanced training & dedicated account manager
- First Priority support
- Custom design implementation
- Export interactive charts and maps for offline use
- Custom development
- SSO
- 99.9% uptime SLA
- Web tracking opt out
- Custom & local maps
Promote Infogram 


Infogram Alternatives
Craft professional dashboards that tell your story


1

12

12

12


49

22