What is Kanaries?
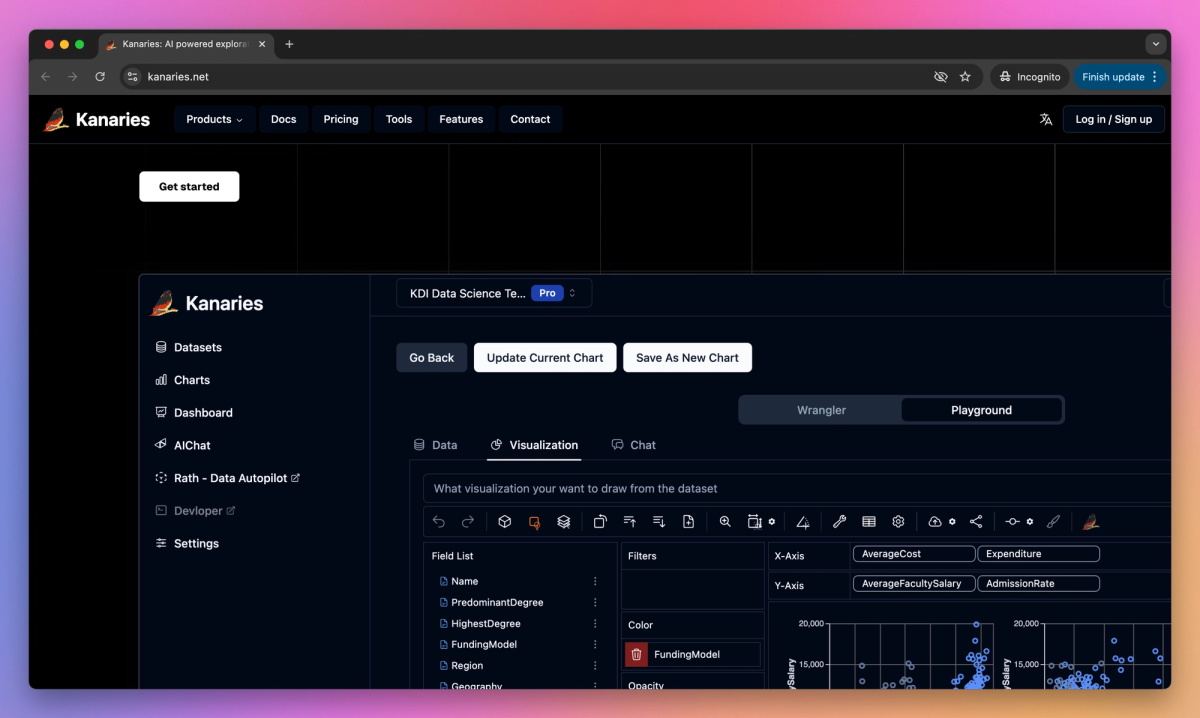
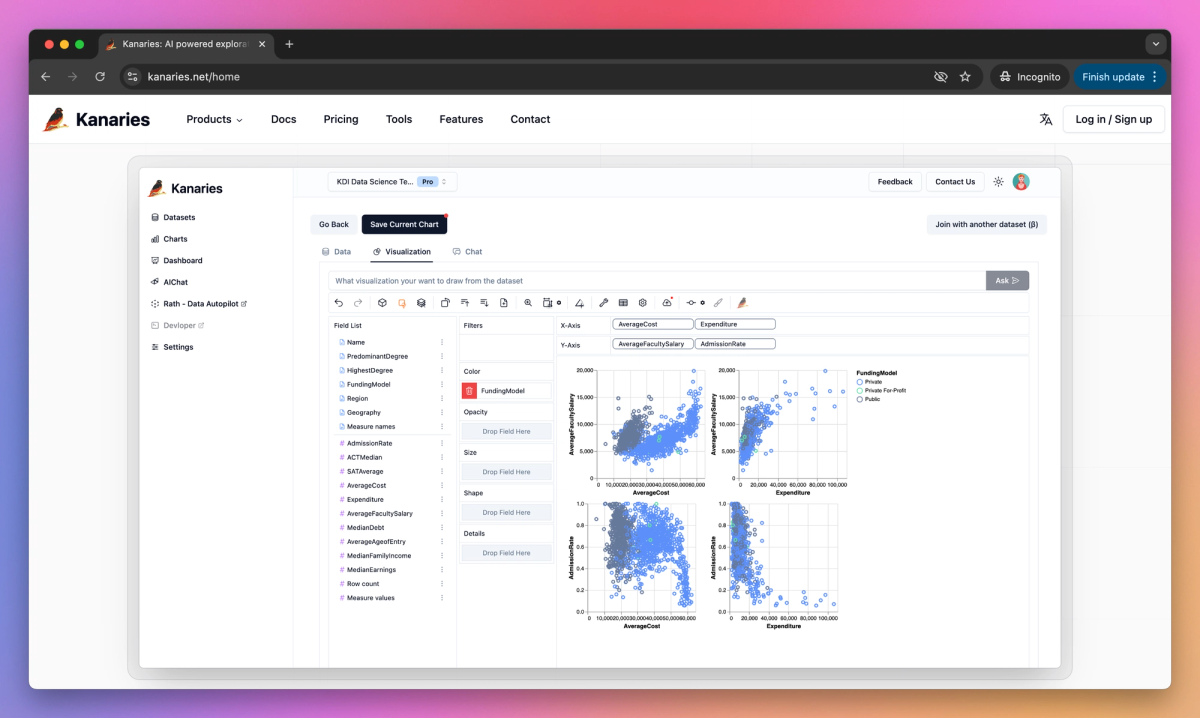
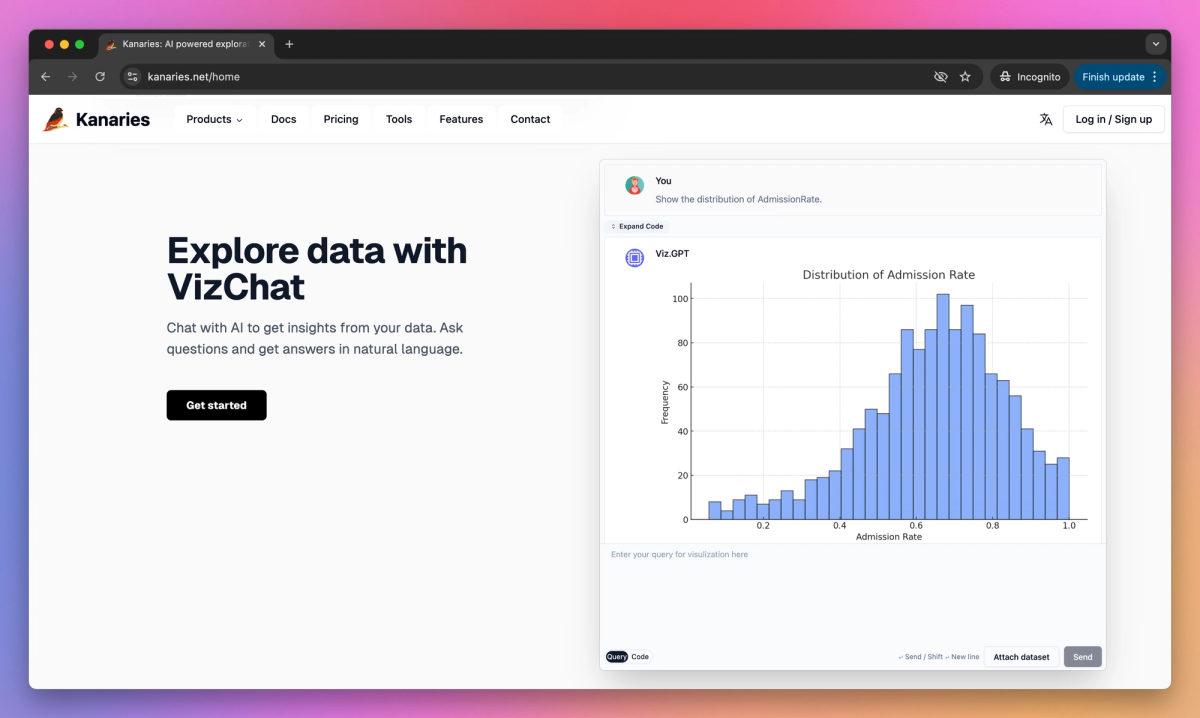
Kanaries is an AI-powered data analysis platform that turns complex datasets into interactive visualization apps with drag-and-drop simplicity. It allows data analysts to clean data using visual tools, create new variables on-the-fly, and collaborate with team members to uncover insights through AI-assisted chat functionality.
What sets Kanaries apart?
Kanaries sets itself apart with its visual data cleaning tools, allowing data analysts to remove outliers and complex patterns by simply using an "eraser" on their datasets. This approach proves valuable for business professionals who need to quickly prepare data for analysis without extensive coding knowledge. By enabling on-the-fly creation of new variables directly within analytical views, Kanaries offers a unique way to explore and understand data in real-time.
Kanaries Use Cases
- Interactive data visualization
- AI-powered data exploration
- Drag-and-drop chart creation
- Collaborative data analysis
- Python/R data app generation
Who uses Kanaries?
Features and Benefits
'/%3e%3cdefs%3e%3clinearGradient%20id='paint0_linear_1182_27871'%20x1='12.385'%20y1='12.5872'%20x2='48.2299'%20y2='32.1489'%20gradientUnits='userSpaceOnUse'%3e%3cstop%20offset='0.0938117'%20stop-color='%2352EB07'/%3e%3cstop%20offset='0.347535'%20stop-color='%233EF040'/%3e%3cstop%20offset='0.768595'%20stop-color='%2300FFF7'/%3e%3c/linearGradient%3e%3c/defs%3e%3c/svg%3e) Transform your data into interactive visualization apps with simple drag-and-drop operations for quick exploration and insights. Interactive Data Visualization
Transform your data into interactive visualization apps with simple drag-and-drop operations for quick exploration and insights. Interactive Data Visualization - Utilize GPT-powered data exploration to chat with your data, asking questions and receiving answers in natural language. AI-Powered Data Analysis
- Share your data and charts with your team, enabling collaborative decision-making and insights. Collaborative Workspace
- Clean your data efficiently with the Data Painter feature, allowing you to remove outliers and complex patterns within seconds. Data Cleaning Tools
- Create charts from various data formats including CSV, JSON, and Excel files, with options to download or embed the visualizations. Multi-Format Support
Pricing
Free Trial'/%3e%3cpath%20fill-rule='evenodd'%20clip-rule='evenodd'%20d='M16.0466%206.18948C16.3178%206.46068%2016.3178%206.90038%2016.0466%207.17157L8.40771%2014.8105C8.13652%2015.0817%207.69682%2015.0817%207.42562%2014.8105L3.9534%2011.3382C3.6822%2011.067%203.6822%2010.6273%203.9534%2010.3561C4.2246%2010.085%204.66429%2010.085%204.93549%2010.3561L7.91667%2013.3373L15.0645%206.18948C15.3357%205.91828%2015.7754%205.91828%2016.0466%206.18948Z'%20fill='%23343634'/%3e%3cdefs%3e%3clinearGradient%20id='paint0_linear_1569_59'%20x1='0.289288'%20y1='-0.211567'%20x2='31.2845'%20y2='15.6364'%20gradientUnits='userSpaceOnUse'%3e%3cstop%20offset='0.0938117'%20stop-color='%2352EB07'/%3e%3cstop%20offset='0.347535'%20stop-color='%233EF040'/%3e%3cstop%20offset='0.768595'%20stop-color='%2300FFF7'/%3e%3c/linearGradient%3e%3c/defs%3e%3c/svg%3e) Connect to PyGWalker
Connect to PyGWalker - Everything in the Pro plan
- Collaboration with others in your organization
- Addon: RATH, autopilot for EDA
- Dashboard and data app sharing
- GPT-powered data exploration
- Team collaboration
- More data sources (DuckDB, PG, Snowflake, etc.)
- Build visualizations with drag-and-drop / chat interface
- Developer Platform
- Engineering Support
- SSO Integration
- OLAP Engine Integration
- Large Scale of Data Support
- Self-deployment
Kanaries Alternatives