Gooddata — AI Data Visualization Tool


What is Gooddata?
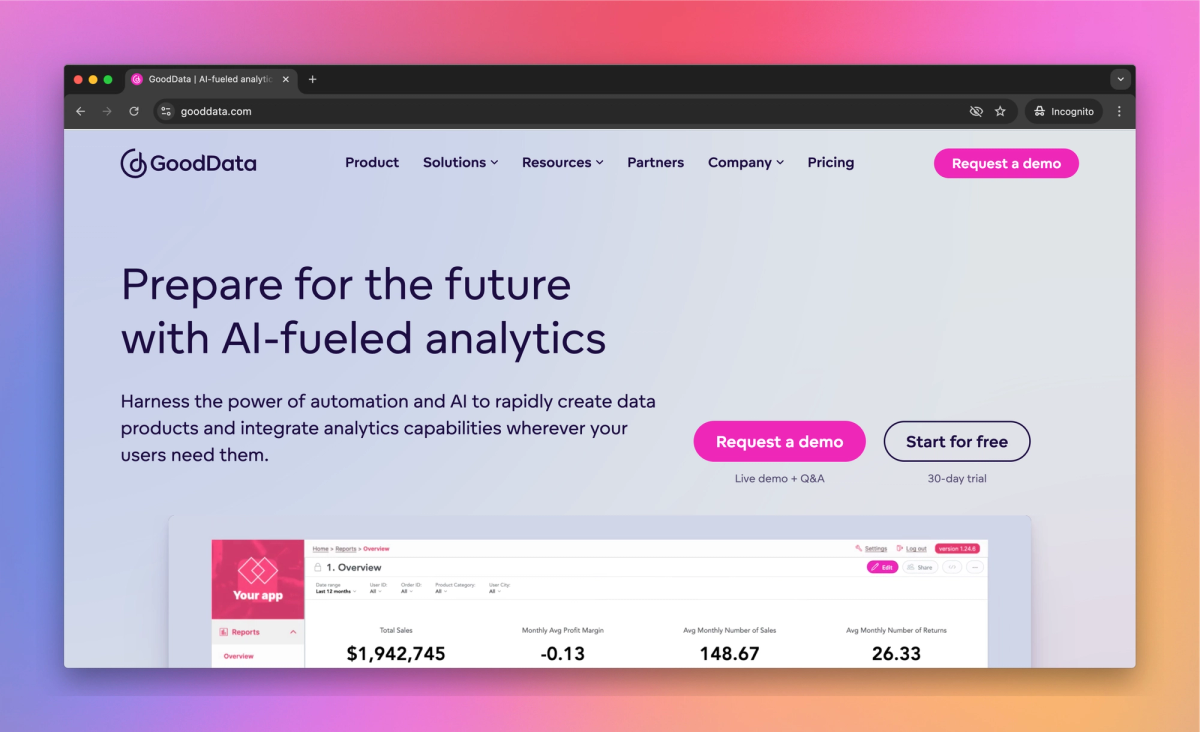
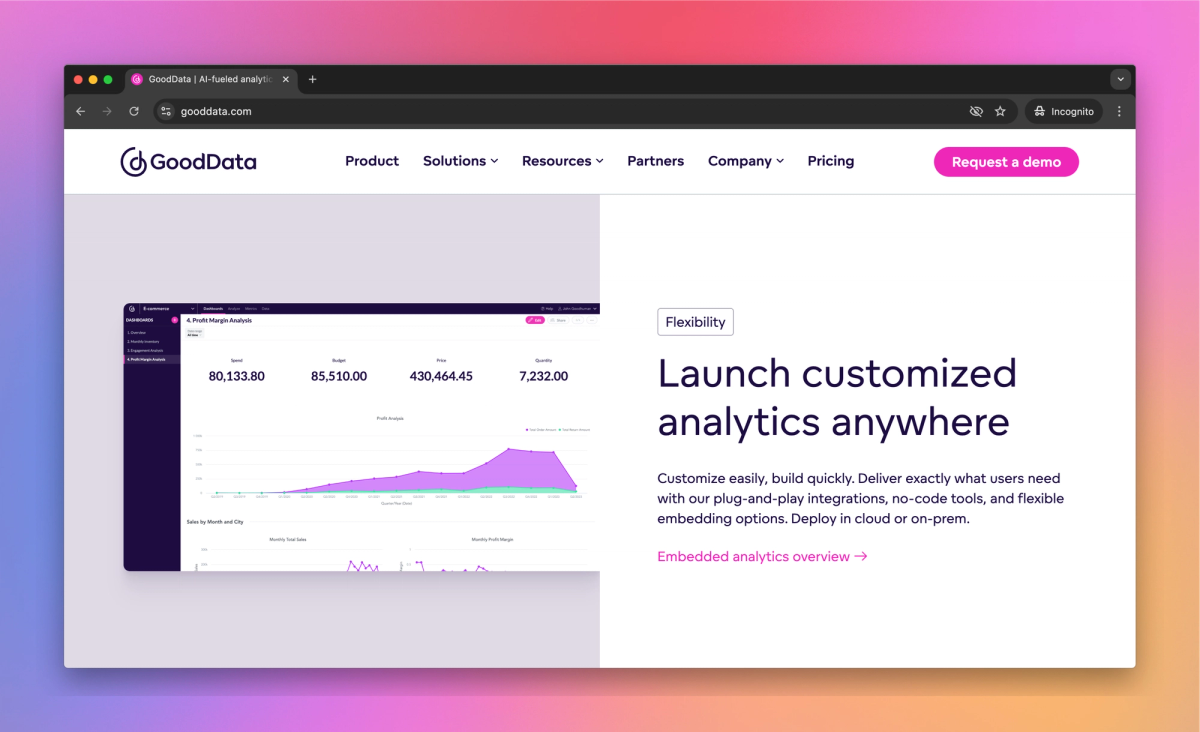
Gooddata equips data analysts with tools to build customizable dashboards that reveal e-commerce customer behaviors and preferences. The platform's multi-tenant architecture enables business intelligence teams to embed these analytics directly into their applications, giving insurance companies precise fraud detection capabilities.
What sets Gooddata apart?
GoodData sets itself apart with its ability to unify data from numerous sources, allowing data scientists to create a holistic view of business operations. This unified approach proves particularly useful for companies managing complex supply chains or multi-channel sales, as it brings clarity to intricate business processes. By leveraging GoodData's scalable architecture, organizations can roll out consistent analytics across departments and external partners, fostering data-driven decision making throughout their ecosystem.
Gooddata Use Cases
- Interactive data visualizations
- Embedded analytics dashboards
- Custom analytics applications
- Multi-tenant data products
Who uses Gooddata?
Features and Benefits
- Integrate interactive dashboards and visualizations directly into your applications or web portals to provide data insights to your users.
Embedded Analytics
- Create customizable charts, graphs, and dashboards to present complex data in an easily understandable format.
Data Visualization
- Manage and distribute analytics across multiple customers or departments from a centralized platform.
Multi-Tenant Architecture
- Develop and manage analytics using software development practices like version control and CI/CD pipelines.
Analytics as Code
- Process and analyze large volumes of data with an in-memory computation engine for improved performance and cost efficiency.
FlexQuery Engine
Gooddata Pros and Cons
Handles large amounts of data efficiently
Flexible and adaptable to business needs
Offers great drill-down options for deeper data analysis
Provides many visualization options
Supports automated reporting
Integrates well within existing platforms
Features a powerful MAQL query engine
Difficult for beginners to use without SQL knowledge
Limited data type options in some cases
Lacks some key features compared to competitors
Steep learning curve for new users
Pricing can be high for small businesses
Classic environment users may miss next-gen analytics benefits
Lacks expandable table reports in the view
Pricing
Free Trial10 users minimum, 30 users maximum
$30/user/month + $1,500 Platform fee
Annual billing
Unlimited number of self-service reports and dashboards
SOC 2, GDPR, and ISO 27001 compliance
$30/user/month + $1,500 Platform fee
Annual billing
Unlimited users & data
Unlimited number of self-service reports and dashboards
SOC 2, GDPR, and ISO 27001 compliance
From $1,500/month
Platform fee + number of workspaces
Annual billing
Unlimited users & data
Unlimited number of self-service reports and dashboards
SOC 2, GDPR, and ISO 27001 compliance
Custom pricing
Enterprise-level security & compliance
Unlimited users & data
24/7 prioritized SLA
Dedicated customer success manager
Custom pricing
Enterprise-level security & compliance
Unlimited users & data
24/7 prioritized SLA
Dedicated customer success manager


