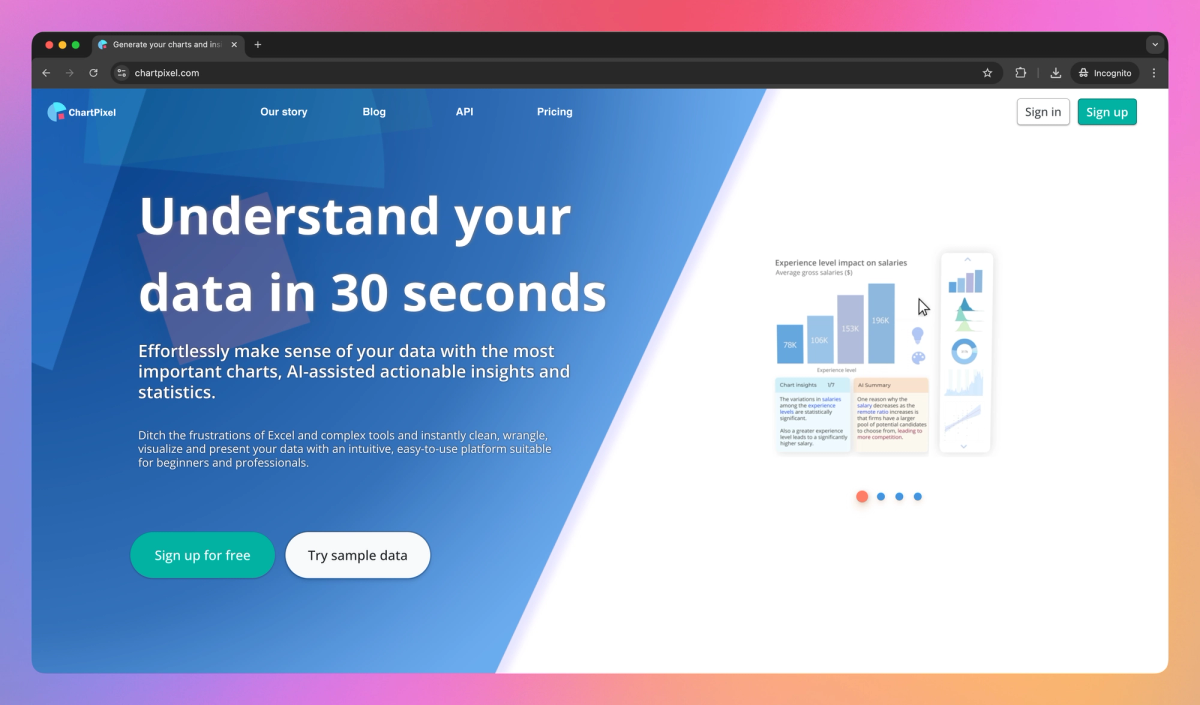
What is ChartPixel?
ChartPixel is an AI-powered data analysis tool that turns raw data into interactive charts and actionable insights. It allows business professionals to upload spreadsheets and quickly generate statistical analyses, forecasts, and visualizations without coding skills.
What sets ChartPixel apart?
ChartPixel distinguishes itself by enabling business professionals to uncover hidden patterns in their data without needing statistical expertise. The tool's user-friendly interface guides managers through the analysis process, helping them learn data interpretation skills as they work. For example, marketing teams can quickly identify customer segments and preferences, allowing for more targeted campaign strategies.
ChartPixel Use Cases
- Instant data visualization
- AI-powered insights generation
- Automated chart creation
- Educational data analysis
- Business intelligence simplification
Who uses ChartPixel?
Features and Benefits
- Transform raw data into interactive charts and insights within seconds, saving time on manual analysis and chart creation.
Automated Data Visualization
- Algorithms automatically handle missing values, country codes, units, and currencies, reducing the need for manual data preparation.
AI-Assisted Data Cleaning
- Generate AI-assisted written insights backed by statistics to help understand the big picture of your data.
Statistical Insights Generation
- Export charts and insights directly into PowerPoint presentations for easy sharing and reporting.
One-Click PowerPoint Export
- Navigate through your data with an intuitive interface designed for users of all skill levels, from beginners to professionals.
Guided Data Exploration
ChartPixel Pros and Cons
Pros
Generates actionable insights backed by statistics
Auto-selects relevant columns and cleans messy data
Engineers new features to guide users through data analysis
Eliminates steep learning curve associated with data analysis tools
Offers AI-assisted data visualization capabilities
Cons
Pricing information not publicly available
Limited user feedback and reviews available
No free trial option mentioned
May lack advanced features for professional data analysts
Pricing
Free $0/mo
Limited to 5 file uploads
Up to 1 MB file size
Up to 1000 rows
Up to 24 columns
Automated data cleaning
AI-assisted data analysis
Store up to 5 free projects
Share projects via link
Limited up to 3 customization actions per project
Silver Subscription $11.99/mo
Up to 5 MB file size
Up to 6000 rows
Up to 32 columns
Automated data cleaning
AI-assisted data analysis
Store up to 20 projects
Share projects via link
Unlimited file uploads
Unlimited customization actions for any project
Gold Subscription $23.99/mo
Up to 10 MB file size
Up to 10000 rows
Up to 64 columns
Add up to 2 team members that share this subscription
Automated data cleaning
AI-assisted data analysis
Unlimited Storage
Share projects via link
Unlimited file uploads
Priority support
10000 API calls
Unlimited customization actions for any project created


